
Dependent Models
The outputs of the following models are used:
|
Model Name |
Model Type |
|
Fracture Detection and Classification |
Object Detection |
|
Drillers Break |
Object Detection |
|
Fracture Mask |
Instance Segmentation |
Data Processing
We have two key methods for identifying discing regions:
- Fracture angle analysis: This method assesses the angle of individual fractures to identify regions of medium to thick discs.
- Crushed/thin discing detection: This method identifies regions of discing where individual discs cannot be assessed and are instead detected as a whole region.
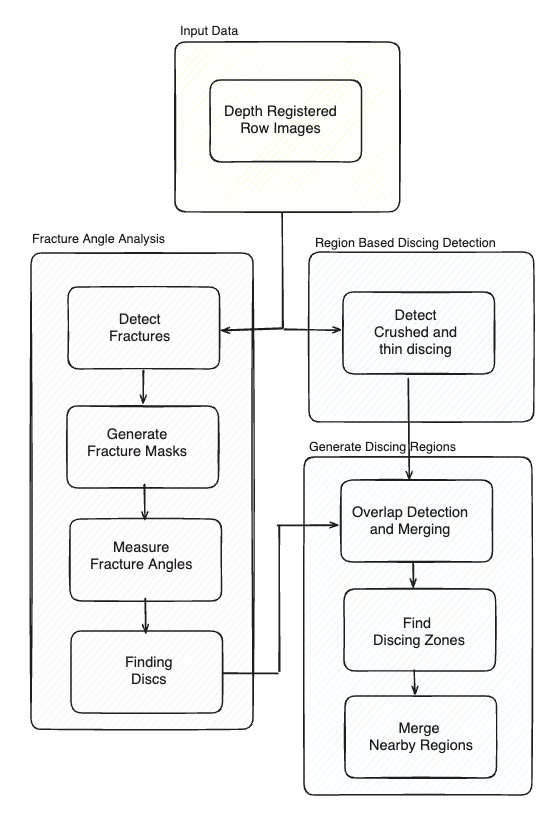
Diagram provides an overview of the process.
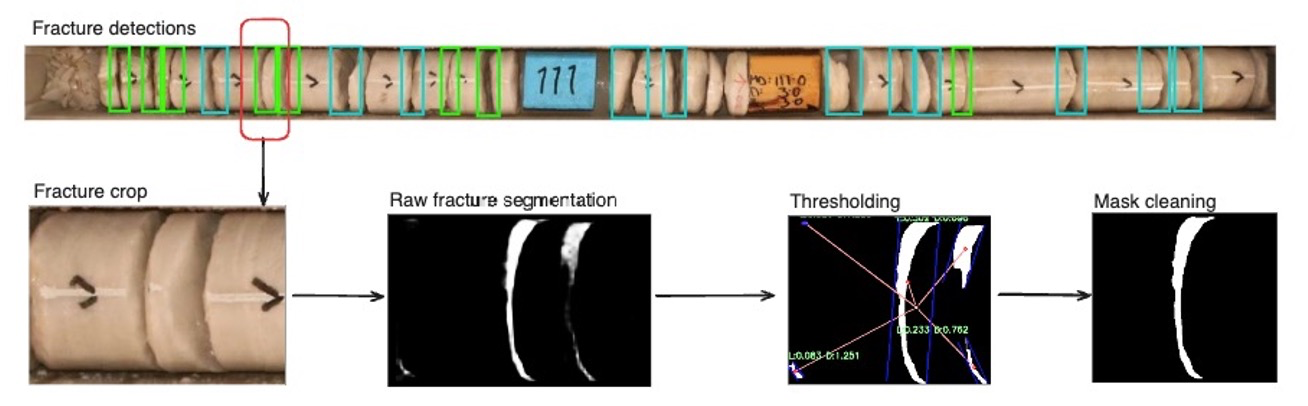
Fracture Angle Analysis
-
Take the output of the fracture detection model, “simple” classes only
-
Run a segmentation model to extract the fracture profile
- Measure the angle of each fracture with respect to the core axis
- Identify potential discs by:
- Measuring the distance between each fracture, referred to as the disc size
- Checking the fractures on both sides of the disc have angles that are similar and near perpendicular to the core axis
Crushed/Thin Discing Detection
- Run an object detection model to identify regions of discing that won't be identified using the angle based method
Generate Discing Regions
- Merge two methods and deal with overlapping detections
- Find discing regions by joining adjacent discs
- Merge ("lump") nearby discing regions if the depth between them is within the defined threshold (see Product Configuration Options section below)
 Example: Down fhole plot for Discing Analysis results
Product Configuration Options
The following parameters can be configured as part of the discing calculation:
|
Configuration |
Options |
|
Maximum size of a disc |
Threshold can be set to any value. Default value is 30mm |
|
Minimum number of discs required to define a discing region |
Threshold can be set to any value. Default value is 3 discs |
|
Maximum distance between adjacent discing regions to merge into one region |
Threshold can be set to any value. Default value is 300mm |
Output Intervals
The output data is based on identified intervals of discing.
User Data
User data is not required for this product.
Data Output
Development is currently underway to enable viewing predictions in Datarock Core.
Results from this model can be obtained using the Downloads dropdown list:

The available CSV files include the following:
-
ProjectName_HoleID_discing_analysis.csv
The CSVs contains the following headers:
|
Column Header |
Description |
|
hole_id |
Customer’s Hole ID |
|
depth_from_m |
Start depth of discing discing region |
|
depth_to_m |
End depth of identified discing region |
| disc_count |
Number of discs in region |
|
ave_disc_size_m |
Average length (m) of discs within the region |
|
ave_disc_angle |
Average angle of the of discs with respect to the core axis |
| good_angle_count |
Count of angles within a discing region that are within threshold |
|
avg_abs_diff_angles |
The average of the absolute difference between each discs two angles (LHS & RHS) within a region. This is a measure of the consistency of the fracture angles. |
| broken_confidence_avg |
Average confidence score of the Crushed/Thin Discing Detection method |
|
merged_with_broken |
Yes or No response based on whether the two different methods of analysis are used for the given interval. |
|
C1 |
Confidence metric based the fracture angles. Calculated using proportion of near perpendicular fractures within a discing region. |
|
C2 |
Confidence metric based on the consistency of the fracture angles within a region. Calculated based on the average deviations of the fracture angles with a discing region. |
|
C3 |
Confidence metric based the number of discs within a region. Calculated based on number of discs in a discing region. More discs indicate higher chances of the region being a truly discing region. |
|
C4 |
Confidence of predictions based on the Crushed/Thin Discing Detection method. |
|
Confidence |
Overall confidence metric for a given region |
Product Limitations
|
Limitation |
Comment |
|
Reliance on open joint detections (angle method) for disc counts |
This product relies on assessment of measured angles of individual open joints/fractures. However, if a region contains intense discing that has broken/collapse as a result of the drilling or core handling, we rely on detection of these regions as a whole, thus limiting the ability to provided detailed stats on the discs. |
Document Version
|
Version |
Date |
Author |
Rationale |
|
1 |
5 April 2024 |
S Johnson |
Initial release |
|
2 |
18 October 2024 |
S Johnson |
Updated with Crushed/Thin Discing Detection |
|
3 |
12 May 2026 |
R Duyvestyn |
Update outputs |