
To identify a colour that best represents an image, we need to understand that colour can be numerically represented in many ways (Colour model), called colour models. When an image, stored as a jpg or png or other file format, is loaded into a computer, the colour of each pixel can be numerically represented by passing saved information to any of these colour models.
One of the most intuitive colour models to think about is the RGB model (RGB colour model ), where the red, green and blue primary colours of light are added together to form a distinct colour. Using this model, the colour of each pixel in our loaded image is therefore defined by an RGB triplet (R,G,B) of numerical information.
The purpose of the Datarock Dominant Colour product is to condense the varied colours represented in the core photograph to consistently determine the dominant colour of the core.
Dependent Models
The imagery only needs to have passed through Depth Registration in order to process Dominant Colour.
Data Processing
The following steps are taken to determine the Dominant Colour of a row image.
-
Taking the depth registered row image (see Analytics Ready Data (Image Preparation + Depth Registration) for more information).
-
Extract every pixel from the image, and plot each RGB triplet onto a 3 axis plot.

-
Cluster all the RGB values into 5 clusters.
- Determine the cluster with the highest number of pixels. This is the dominant cluster.
- Find the geometric centre of the dominant cluster. The R, G and B values of this point is our Dominant Colour.
-
Convert the RGB value to hex and export both.
Example Output
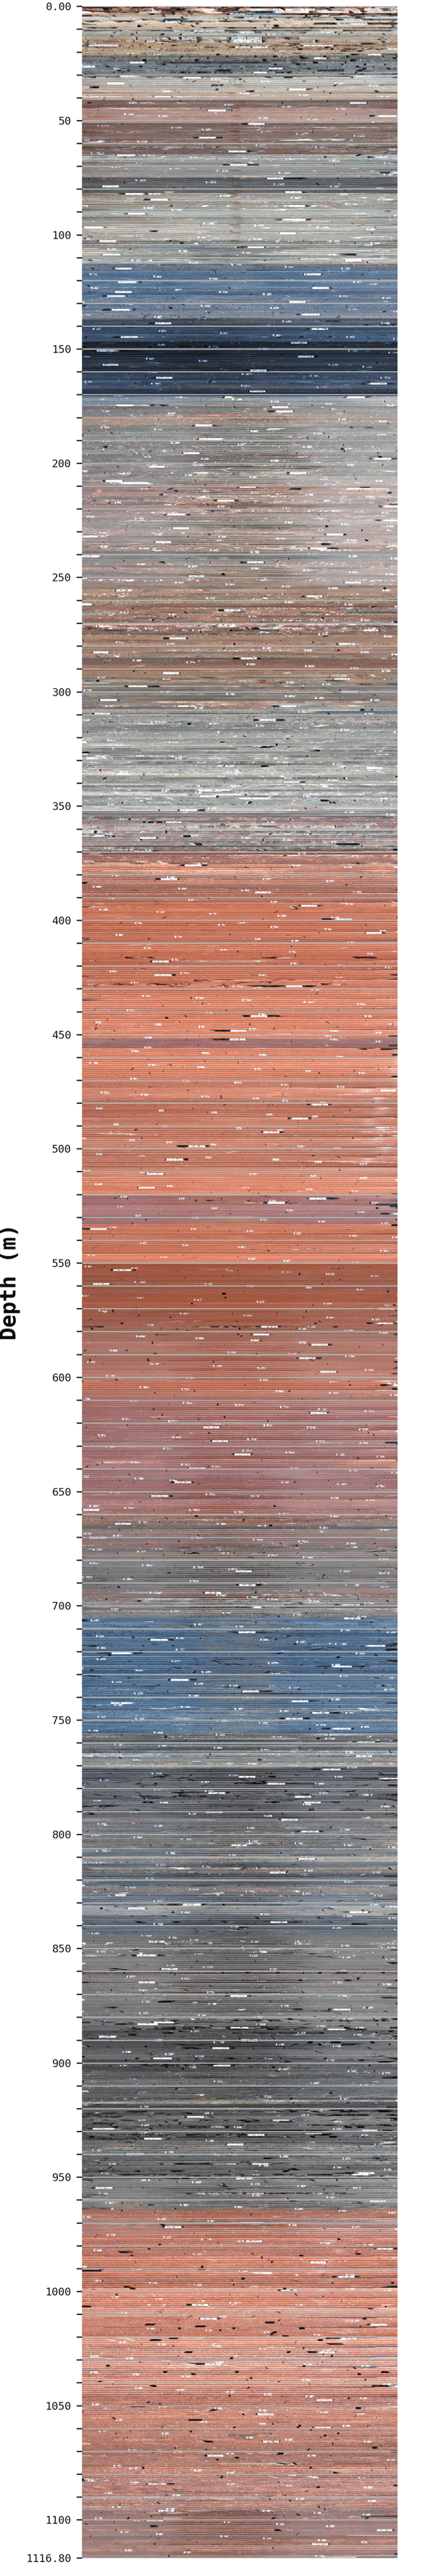
The images below show an example of the extracted row images. Key points:
-
Hole is 1,116m deep
-
Raw images were 380 megabytes
-
Processed data (csv format) is ~100KB
This results in a significantly compressed representation of the core images that can be used to plot in 3D modelling packages or further data analysis.
|
Depth registered row images |
Dominant colour row images |
|---|---|
|
 |
Product Configuration Options
There are no configuration aspects to this product.
Output Intervals
Data intervals are based on the calculated depth of each row image.
User Data
Not currently able to upload to the platform.
Data Output
Results from this product is delivered in a batch nature.
Integration of the required technologies into Datarock production is ongoing.
The available CSV files include the following:
-
ProjectName_Dominant_Colour_by_row.csv
|
File Header |
Description |
|
hole_id |
Customer’s Hole ID |
|
depth_from_m |
Start of interval (metres) |
|
depth_to_m |
End of interval (metres) |
|
R |
Red component of the dominant colour |
|
G |
Green component of the dominant colour |
|
B |
Blue component of the dominant colour |
|
hex |
Hex colour code for the dominant colour |
Product Limitations
|
Limitation |
Comment |
|
Measurements are taken on the full row image |
The full row image is ingested and to determine the dominant colour. Is most cases this is more than suitable for determining the dominant colour of the core. However, in some row imagery, non-rock areas in the image such as empty track or core block can dominate the image, resulting in the dominant colour representing these non-rock areas. |
Document Version
|
Version |
Date |
Author |
Rationale |
|
1 |
6 Dec 2023 |
S Johnson |
Initial release |
|
2 |
29 Jan 2023 |
S Johnson |
Updated units for outputs |