
Dependent Models
The imagery only needs to have passed through Depth Registration in order to process Geotechnical Weathering Intensity.
Data Processing
The key processing steps for this product are:
-
Divide all rock into squares
-
Classify each square with the most probable weathering intensity. We have a general model training across a range of deposits, and deposit specific model tuning is completed as part of our normal model building workflow. As per the International Society for Rock Mechanics and Rock Engineering (ISRM), the predictions will be one of the following:
-
Fresh/Unweathered
-
Slightly Weathered
-
Moderately Weathered
-
Highly Weathered
-
Completely Weathered
-
Residual Soil
-
-
Composite results over intervals.
The outputs of the Coherent Rock and Drillers Break models are combined to create an understanding of natural coherent rock pieces.
Product Configuration Options
There are no configuration aspects to this product.
Output Intervals
Default interval lengths: raw data is produced at ~0.05m scale as well as composited intervals of 0.5m, 1m, 2m, 3m and 5m.
Customisable interval is available: Yes, via uploading sample table to platform (see User Data below).
User Data
User data may be uploaded to the platform via csv in the following format:
-
HoleID_sampling_intervals_weathering_intensity.csv
CSV file to contain the following headers:
|
Column Header |
Description |
|
depth_from |
Start of interval |
|
depth_to |
End of interval |
|
groundtruth |
Degree of weathering logged on site. This is an optional field. |
Data Output
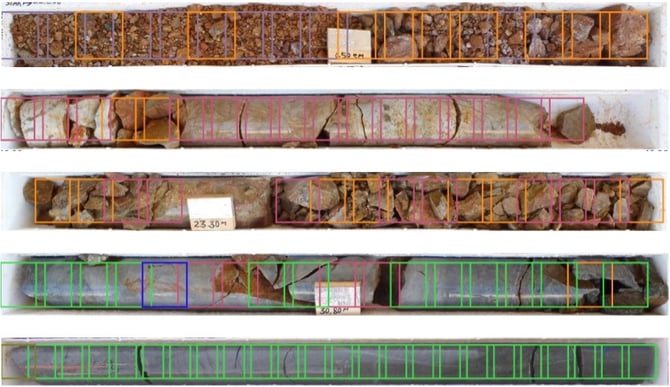
Results from this class of models can viewed in the Platform in the Results tab - overlain on core imagery - only when imagery is trained on 5cm square tiles. If imagery is trained on a different tile size (e.g. 1m or row tiles), results cannot currently be visualised in the Platform, but can be exported from the Platform. 
Example: Geotechnical Weathering Intensity model classes visualised on the Platform
Results from this model can be obtained using the Downloads dropdown list:
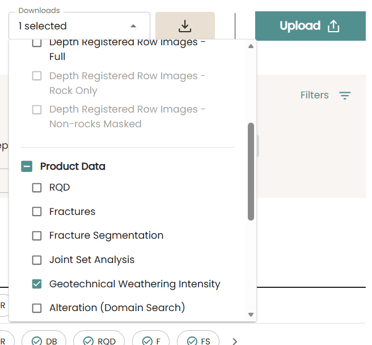
The available CSV files include the following:
-
Raw Data
-
ProjectName_HoleID_geotech_weathering_intensity_square.csv (per drill hole)
-
ProjectName_HoleID_geotech_weathering_intensity_interval.csv (per drill hole). These intervals are based on joining adjacent squares with the same predicted class.
-
-
This file contains the below data based on the raw predictions on each square (as shown in the image above)
-
File headers are outlined in this table:
|
Column Header |
Description |
|
hole_id |
Customer’s Hole ID |
|
box_number |
The box number containing the interval |
|
depth_from_m |
Start of interval (metres) |
|
depth_to_m |
End of interval (metres) |
|
depth_from_ft* |
Start of interval (feet) |
|
depth_to_ft* |
End of interval (feet) |
|
class |
The predicted weathering intensity |
|
probability |
The probability, or confidence, of the prediction |
|
inference_timestamp |
Date and time of model prediction |
|
classification_source |
Identifies the source of the prediction: model or user (via Expert in the Loop) |
|
edited_by |
Username of user who has edited prediction |
|
version |
A model version identifier |
*Only included if project depths are in feet.
-
Composite data based on the output intervals described above:
-
ProjectName_HoleID_geotech_weathering_intensity_user_intervals.csv
-
ProjectName_HoleID_geotech_weathering_intensity_composite_Xm_intervals.csv
-
This file contains the below data based on the sample file provided.
-
File headers are outlined in this table:
-
|
Column Header |
Description |
|
hole_id |
Customer’s Hole ID |
|
depth_from_m |
Start of interval (metres) |
|
depth_to_m |
End of interval (metres) |
|
depth_from_ft* |
Start of interval (feet) |
|
depth_to_ft* |
End of interval (feet) |
|
class |
The predicted weathering intensity |
|
probability |
The probability, or confidence, of the prediction |
|
inference_timestamp |
Date and time of model prediction |
|
classification_source |
Identifies the source of the prediction: “model” or “user” (via Expert in the Loop) |
|
edited_by |
Username/email address of user who edited the prediction |
|
version |
A model version identifier |
*Only included if project depths are in feet.
Product Limitations
|
Limitation |
Comment |
|
Training is dependent on what can be seen within a tile image |
Datarock’s Classification model relies on classes being predicted using visually identifiable RGB features some of which are too subtle to predict from a photo, particularly if resolution is poor. Tile imagery during the training process also does not provide geological context for individual squares when sampled at random. For example, two orange coloured tiles could both be predicted as “highly weathered” but one is near the surface (weathered rock and therefore true positive) and the other at 1,000m depth (hematite-oxidation in an IOCG and therefore a false positive). Site-based logging can be used to assist in class training of these false positives, however logging is not always at the same resolution as 5cm tiles. Tiles which fall at the end of the rows may only contain a fraction of rock and thus can cause confusion for the model. However, while there may be confusion on individual tiles, generally composite data over normal logging intervals will minimise overall error. |
|
Training data must be representative if whole area classification is to be applied |
If new imagery is introduced to the model, the performance may decline as these examples were not trained during model tuning. An initial model evaluation will need to be undertaken to see the suitability of the model in particular against any new imagery. Ideally, a new model version is trained to incorporate the new untrained imagery. |
Document Version
|
Version |
Date |
Author |
Rationale |
|
1 |
15 June 2023 |
S Johnson |
Initial release. |
|
2 |
29 Jan 2024 |
S Johnson |
Updated to include depth in feet. |
|
3 |
28 Jan 2025 |
M Fracchia |
User data updated. |
|
4 |
13 May 2026 |
R Duyvestyn |
Data Output updated |