
Overview
The process of triggering a product is similar regardless of what is being run however, there may be some differences between input requirements and viewing results.
Image Preparation
A pipeline that prepares images for future processing. This pipeline will extract the box(es) and then extract rows for each of the boxes from the image.
-
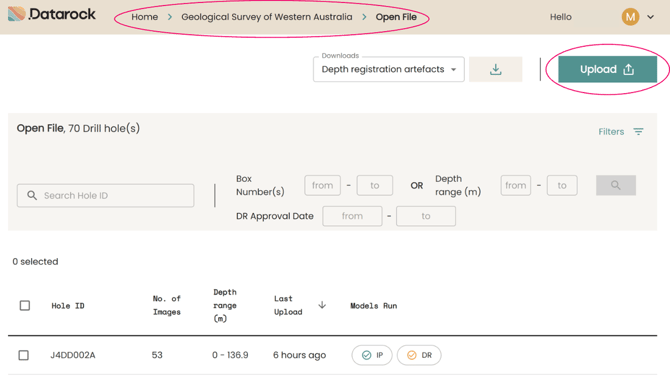
Navigate to the Project page of the Datarock Platform
-
Locate the Upload button (top right of screen)
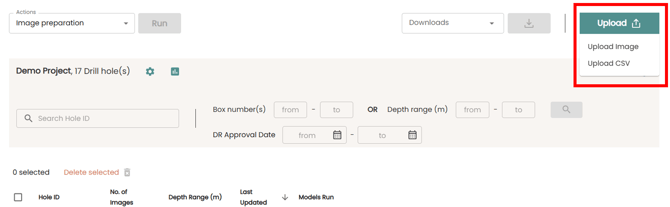
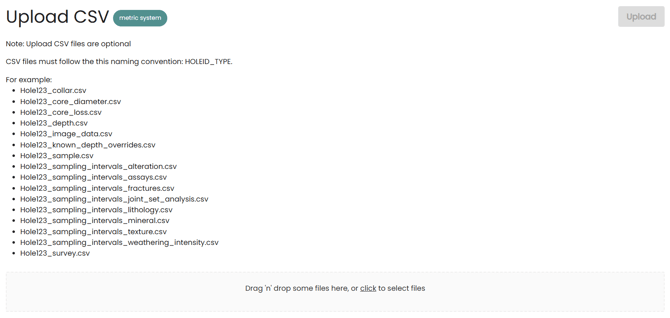
Using the Platform Uploader, you can easily upload both images and related CSV data (such as depth, sample, core loss, or fracture interval files) by simply dragging and dropping them into the uploader bar.
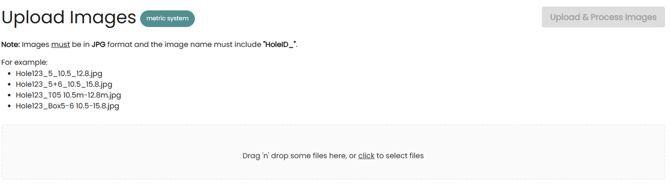
Image Requirements
Accepted image metadata formats for Datarock must follow specific guidelines:
-
.JPG file
-
Core orientated horizontally within the frame and depth increasing from left to right moving down the image
-
HOLEID_BOXNUMBER+BOXNUMBER_FROMDEPTH_TODEPTH (optional)
-
Depth metadata is optional but will require a depth file (a CSV containing the start and end depth of the hole) to be uploaded in its place.
-
DDH001_1
-
DDH002_1+2+3
-
DDH001_1_0_6.2
-
DDH002_1+2+3_0_18.3
-
-
Images cannot be rotated within the platform currently. Before uploading, make sure that all images are positioned so that the core rows progress in depth from the top left to the bottom right of the image.
Potential Scenario 1
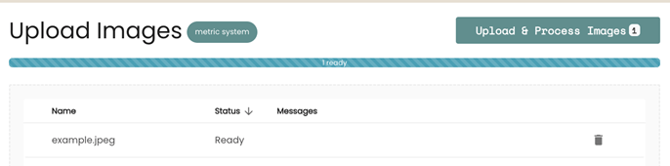
In the best-case scenario, where there are no errors or warnings, the upload process can proceed smoothly.
Potential Scenario 2
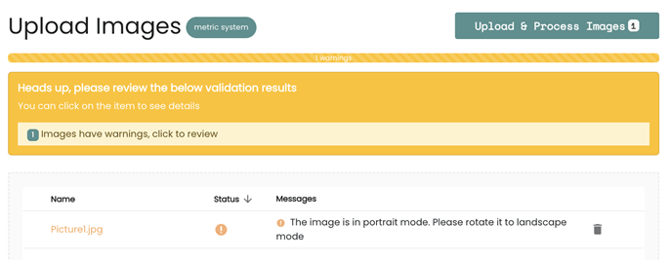
If there are any warnings about missing depth metadata or orientation inconsistencies, you can still proceed with the upload. However, it is important to thoroughly check and ensure that everything is acceptable before moving forward. In cases like this, a depth file will need to be uploaded.
Potential Scenario 3
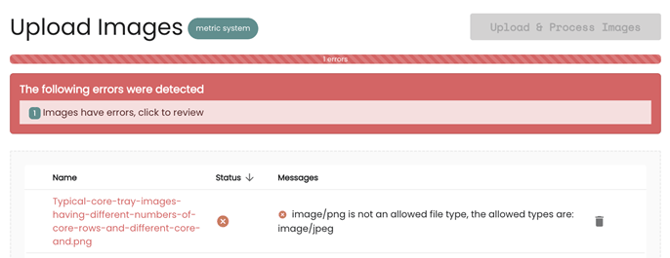
Before proceeding with the upload, it is crucial to address any critical errors. These errors typically involve duplicate box numbers and overlapping depths, which need to be resolved before continuing with the upload process.
Triggering Image Preparation

Once a hole is uploaded, the process of Image Preparation is automatically initiated. If any issues arise causing the process to fail (such as missing depth metadata), it is essential to resolve these issues and manually re-trigger the Image Preparation process.
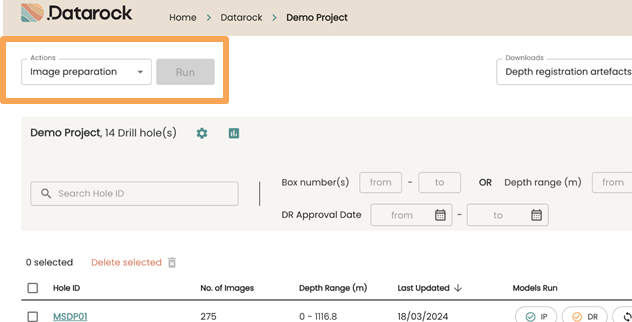
To manually initiate the Image Preparation process:
1. Go into the specific drill hole you want to work on.
2. From the Actions menu, choose the option to Rerun Image Preparation.
3. Click on the Rerun button to start the process again.
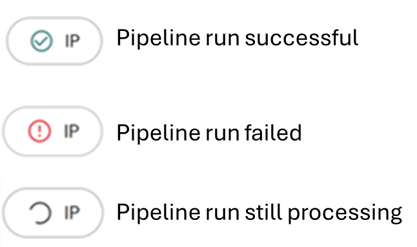
These icons, known as 'Pill Boxes', represent the different states of a pipeline run in the Datarock process:
- Successfully completed (indicated by a green tick)
- Failed to complete (indicated by a red exclamation mark)
- Still processing (indicated by a spinning circle)
Depth Registration
A pipeline that determines the depth where rock came from underground, relative to the start of the drill hole. To achieve this, we run the rows through machine learning models (coherent rock, incoherent rock, empty tray, and core block) and OCR and then apply some computational logic.
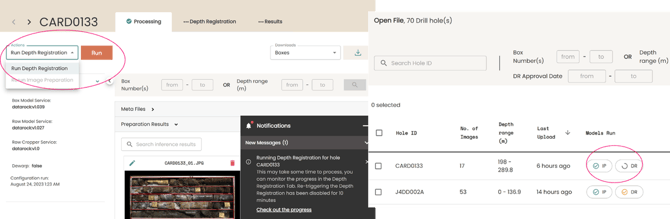
Choose the option to Run Depth Registration from the actions menu and click on Run. Once the processing begins, you will see the pill box icon start spinning (as shown above).
Completing Depth Health Checks

If there are Depth Health Checks to be completed, you will see areas of concern highlighted in the Notifications panel. Common issues that may lead to more checks include:
- Missing depth metadata: The more ground truth depths, the better the results.
- Missing core loss files: Including these files helps the depth registration process handle significant missing intervals effectively.
- Poorly performing models: Inaccurate predictions or missed data can impact the accuracy of depth registration outcomes.

By selecting the interval or box numbers shown in the notifications panel, you can view the specific area for further inspection. For instance, in the given example, if the image lacks depth metadata, users can correct this error by inputting the starting and ending depths of the image.
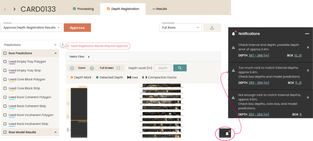
Approving and Revoking Depth Registration Results

Approving Depth Registration can be done via the Actions menu in the drill hole page.

Depth Registration Results can be revoked at anytime via the Revoke button located in the drill hole page. Once confirmed and results have been approved, the orange tick will turn green in both the drill hole tab and the pill box icon in the projects page.
Visualising Depth Registration results
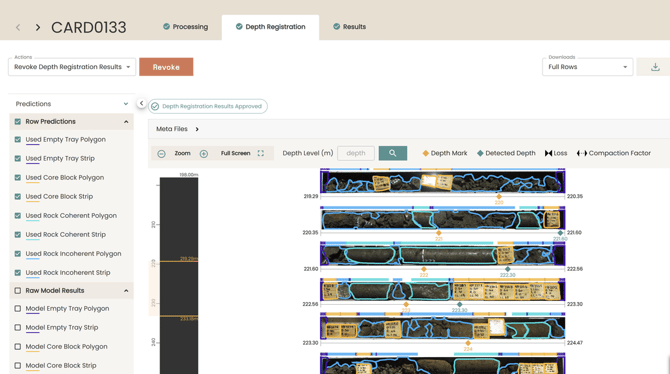
Example Depth Registration model prediction results.
Driller's Break and Rock Quality Designation (RQD)
Driller’s Breaks:
-
Fracture induced by the drilling process. Typically symbolised by a red 'X' on either side of the fracture in the core sample.
RQD:
-
Rock Quality Designation. A measure of rock quality that counts the pieces of rock that are ≥ 10 cm long. The measurements are made for a series of intervals (standard 1m or customisable).

After Depth Registration Results have been approved or depth results have been deemed appropriate without approval, RQD can be run. Triggering RQD from the Actions menu in the drill hole page, will automatically trigger the Driller's Break model to run prior to RQD.
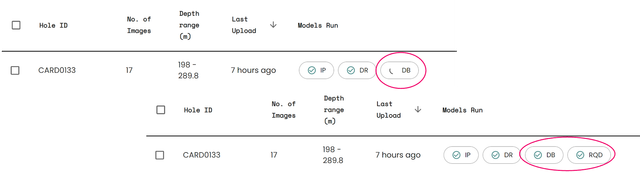
Once both Driller's Breaks and RQD have successfully run, pill box icons will turn green
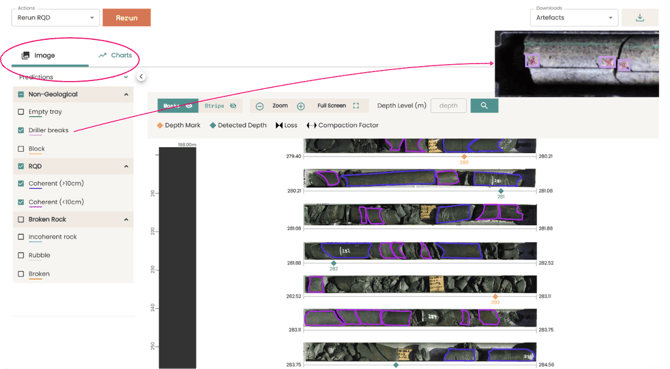
Example Driller’s Breaks and RQD data. Results can visualised polygons and bounding boxes as above or, as charts (below).
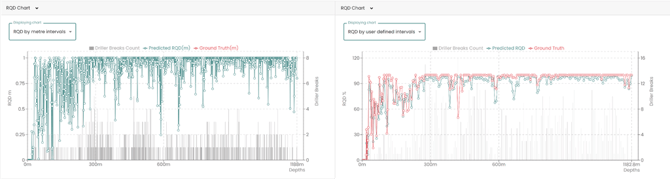
RQD charts are available on metre intervals or when an accompanying user interval file has been uploaded, RQD is also calculated on given intervals and compared to ground truth data (if supplied). NB: The charts and visuals are from different drill holes.
Fractures
A general term to include any kind of discontinuity in a body of rock if produced by mechanical failure, whether by shear stress or tensile stress. Fractures include faults, shears, joints, and planes of fracture cleavage. Using machine learning, we then classify the predicted fractures into a series of geotechnical categories (refer to our glossary for a complete breakdown of classes).
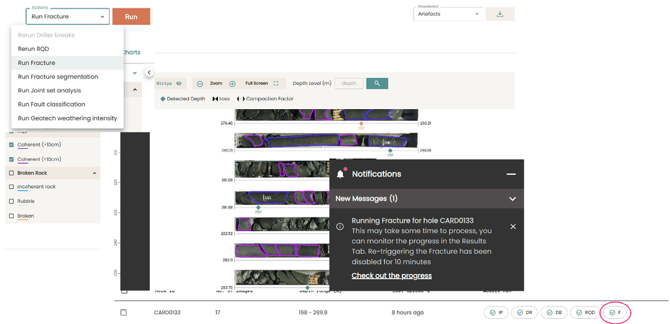
The Fracture pipeline can be triggered through the Actions menu in the drill hole page under the Results tab.
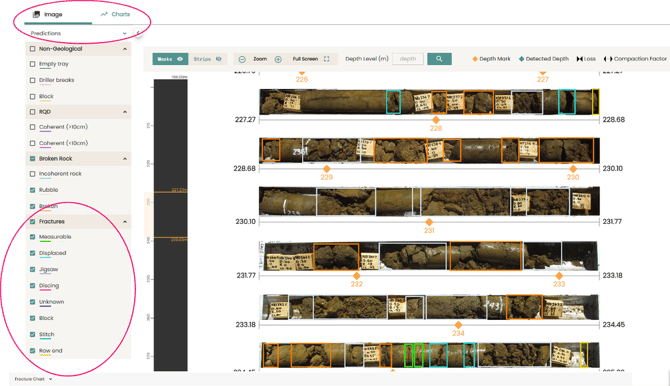
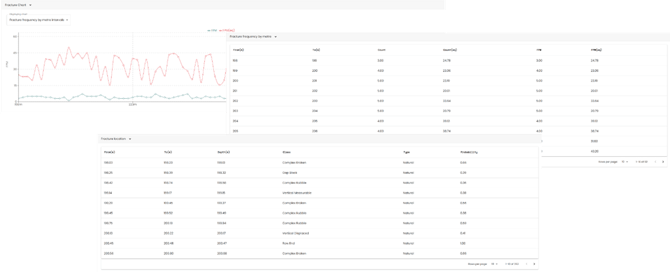
Example Fracture model prediction results. Upon successfully running, the Fractures legend will populate along the left panel of the drill hole page under the Results tab. Results are available as images, charts or tabular outputs (below).
Fracture Segmentation
 The Fracture Segmentation pipeline can be triggered through the Actions menu in the drill hole page under the Results tab.
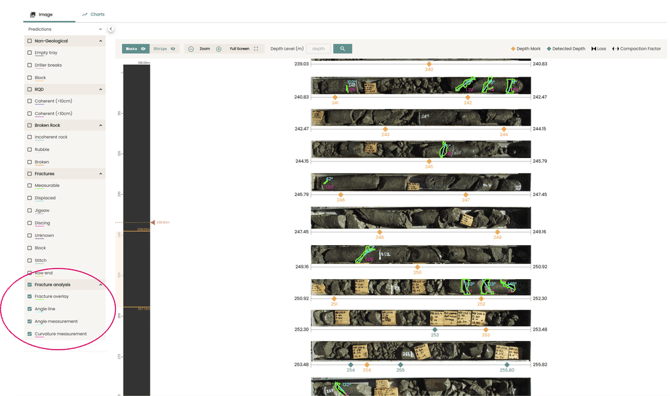
Example Fracture Segmentation model prediction results. Upon successfully running, the Fracture Segmentation legend will populate along the left of the drill hole page under the Results tab.
Joint Set Analysis
Datarock’s method of analysing joints to determine joint set number in line with the Q-System to determine
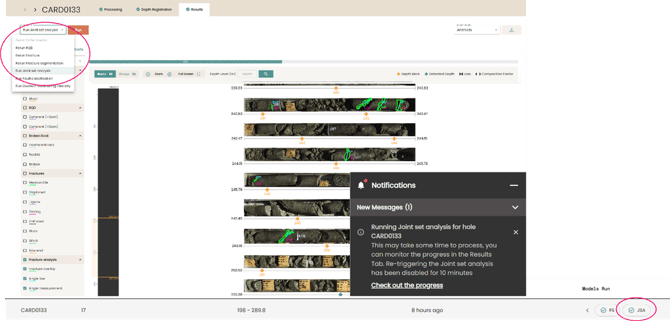
The Joint Set Analysis pipeline can be triggered through the Actions menu in the drill hole page under the Results tab.
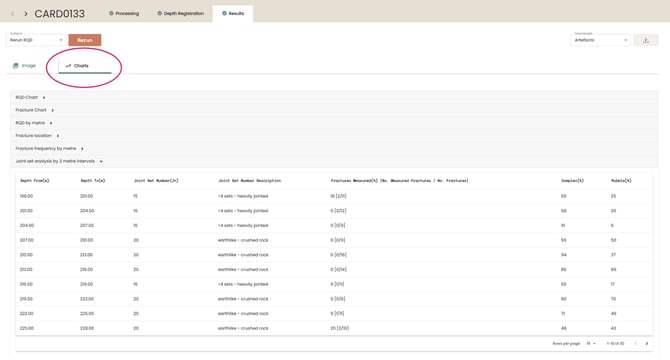
Joint Set Analysis results can be located in the Charts option of the Results tab, by default, intervals are set at 3m.
Classification
Fault Classification
Fault Characterisation has been used here as an example, however the same process applies for all classification models such as Alteration, Lithology, Fault Classification etc.
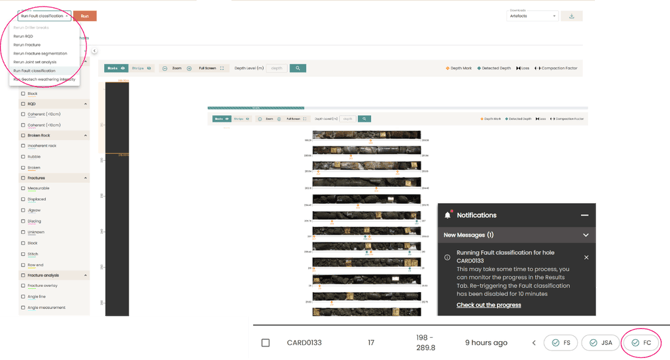
The Fault Classification pipeline can be triggered through the Actions menu in the drill hole page under the Results tab.
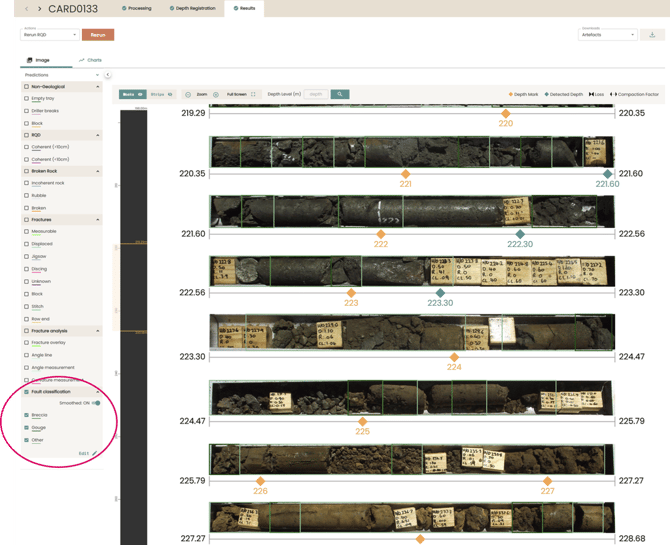
Example Fault Classification model prediction results. Upon successfully running, the Fault Classification legend will populate along the left of the drill hole page under the Results tab. The results of this pipeline are editable within the platform via the Expert in the Loop (EitL) function. For detailed instructions on this process, please refer to the following guide Expert in the Loop - Square Classifications
Geotechnical Weathering Intensity
The degree to which the rock is weathered based on its appearance in the core image.
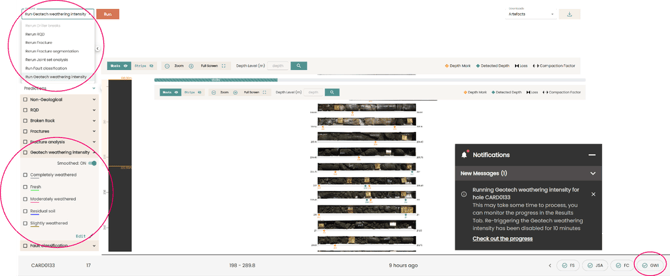
The Geotech Weathering Intensity model pipeline can be triggered through the Actions menu in the drill hole page under the Results tab. The results of this pipeline are editable within the platform via the Expert in the Loop (EitL) function. For detailed instructions on this process, please refer to the following guide Expert in the Loop - Square Classifications